Blogger Kevin Drum has made repeated attempts to bust the "myth" that homeownership is becoming less common among young adults in the United States. After his latest attempt, using data from the Current Population Survey, some people noticed that he made up an extrapolated data series in order support his thesis. But there's a more subtle error in the post, and it's one that also appears in a previous post he made using data from the Consumer Expenditure Survey. It has to do with the definition of the term "homeownership rate."
Here's the chart Drum made. Ignore the dashed red line. That's the part he made up. The chart has two lines, one labeled "All" and another labeled "under 35". It is the latter that Drum uses to argue that the rate of homeownership among young adults is stable.

Below is my attempt to replicate Drum's chart using CPS-ASEC microdata. It confirms that not much changed from 1994 to 2018 among either age group.
The key to understanding Drum's mistake is in understanding how homeownership rates are defined. Homeownership rates do not represent the percentage of people who own homes. They represent the percentage of occupied housing units that are owned (not rented) by the inhabitants. The Census Bureau does calculate homeownership rates by age and race. This leads some people to misunderstand the rate as the prevalence of homeownership among these groups. But these rates are based only on the age and race of the "householder." In Census Bureau surveys, the householder (sometimes called the "reference person") is one person in whose name the housing unit is owned or rented. (Note that in Census Bureau terminology, the number of occupied housing units is equivalent to the number of households, and also to the number of householders.)
This distinction might sound arcane and nitpicky, but it makes a real difference. The main reason it matters is that a large portion—41.8%—of people in the 18 to 34 age group live in a household where the householder is age 35 or older. In 1976, that percentage was 35.2%. These people are not householders, and the Census Bureau's definition of homeownership rate ignores them entirely.
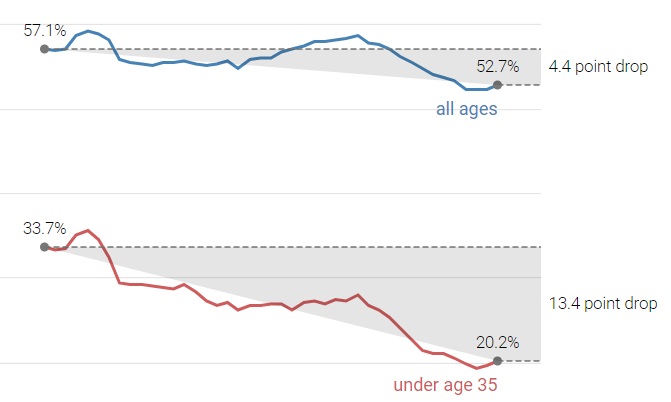
Calculating the prevalence of homeownership across all people—not just householders—reveals the true prevalence of homeownership among 18- to 35-year-olds, and it looks very different from Drum's preferred narrative.
Note: I'm counting spouses of homeowning householders as homeowners as well.
The prevalence of homeownership among all adults dropped from 57.1% to 52.7% between 1976 and 2018. But the drop in the under age 30 group—from 33.7% to 20.2%—was much larger. It's not an easy task to determine what caused this drop. There are other trends that coincide, such as later marriage and later childbearing. But it is possible that economic conditions are responsible for the drop in homeownership, as well as these other trends. What is less disputable is whether homeownership is declining among young adults: It is.
Note: Counting unmarried partners of homeowners as homeowners only raises the 2018 rate to 21.7%.