Earlier this week, IndyStar accused the city of Indianapolis of lagging in its response to potholes in poor neighborhoods. They alleged, based on their analysis of pothole complaints made through the Mayor's Action Center (MAC), that complaints about road conditions in poorer parts of the city are not addressed as quickly in the MAC system as those in wealthier neighborhoods. What follows here is a deeper analysis of the data and questions raised by IndyStar's article.
From June of 2015 through November 22nd of 2017, there were over 37,000 complaints created and closed via the MAC about potholes (or "chuckholes" in the city's terminology). This analysis focuses on a subset—just under 31,000—of those complaints: potholes in streets (not alleys or berms) maintained by the Indianapolis Department of Public Works (DPW), with locations that were successfully geocoded and matched to the city's database of street centerlines.
The variable of interest is the length of time between when a complaint was created and when it was closed, which IndyStar refers to as "response time." This response time measure has a wide range in this data, from 3 minutes and 46 seconds, all the way up to 808 days. These extreme values suggest that the data is not perfect. Of particular concern for this analysis are the longer response times, which might have large effects on averages.
Did it really take years to fill some potholes?
An examination of the 30 pothole complaints with the longest response times (range: 491 days to 808 days) confirms that many of these times do not represent potholes that were reported but went unfilled for years. Of the 30 potholes, 12 had their locations photographed by Google Street View at a time between the creation of the complaint and when the complaint was closed.
There were three cases with minor, shallow potholes visible, and one where the road was generally in poor condition. But in the remaining 8 cases, the road appeared to be in decent condition, with no visible holes or large cracks. For example, a complaint was created in August 2015 for the 2200 block of S Meridian Street, but the street appeared to be in excellent condition in August 2015 and in August 2016. The complaint was not closed until September of 2017.
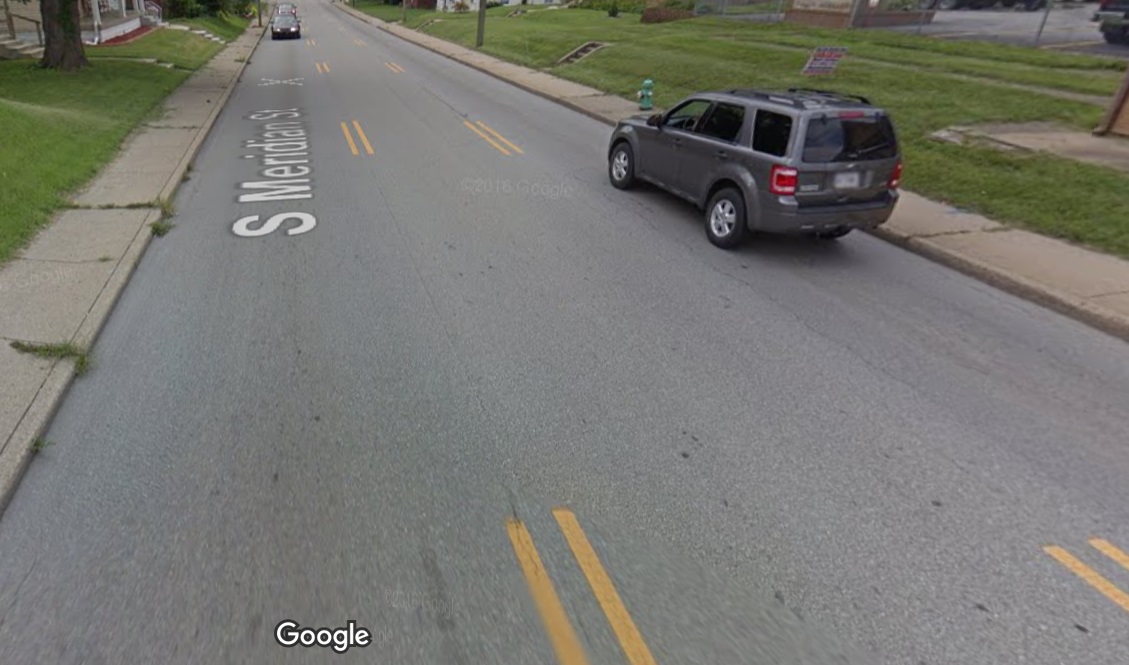
A pothole complaint on this section of road was opened in August of 2015 and closed in September of 2017
It is possible that some of these complaints were intended for back alleys, but were misreported or miscategorized as streets. But given the possibility that data quality is poor at the high end of the response time range, one simple improvement over IndyStar's analysis is to look at median response times instead of averages. The median response time of pothole complaints citywide is a bit over 3 days and 5 hours. This is significantly shorter than the average response time of 7 days and 17 hours.
What's happening at Washington Street?
One curious feature in the data is a dramatic difference in the response times as one moves across Washington Street. The median response time for potholes north of Washington Street is just over 4 days, while the response time south of Washington Street is only 2 days. Figure 2 plots the response time by street to demonstrate this phenomenon. It is difficult to say whether this difference reflects a real difference in the city's response to potholes or if there is some other cause.
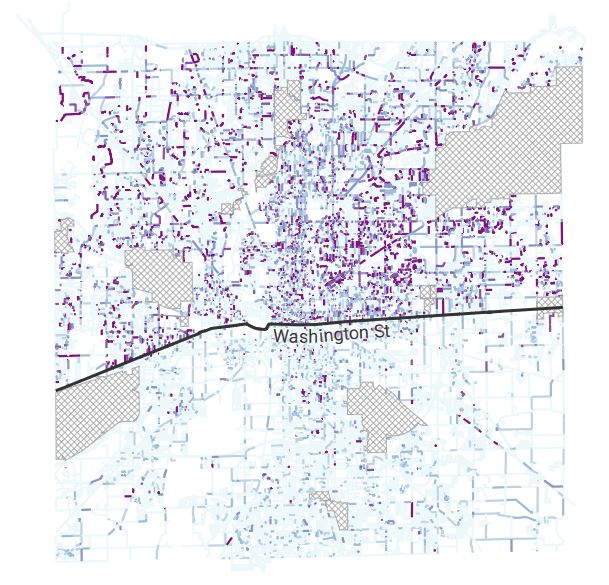
For much of the city, Washington Street serves as the divider between north and south directionals on street addresses. This suggests that there might be some systematic process—perhaps the MAC system's standardization of address inputs by users—that led problems with the quality of the data. It's possible, but it seems unlikely that an issue of this size would go unnoticed for long. Also, at the point where Washington Street bends south (on the west side of the city near the airport), the division between north/south street directionals shifts to Rockville Road, but the response time differential in the pothole data still appears to follow Washington Street.
Do poor neighborhoods recieve poorer service?
Mapping the median response time by census block group (figure 3), as well as the median income in each block group (figure 4), it seems the patterns are distinct from each other. High response times are spread throughout the northern half of the city, while poorer neighborhoods are concentrated all around the city center.
Using the same income groups that were defined by IndyStar, potholes in low income neighborhoods do see a longer response time than those in middle income neighborhoods, but the difference is small: 53 minutes and 24 seconds. Being in a high income neighborhood brings the median time down by another 62 minutes and 16 seconds.
Can other factors explain the disparity?
Given the variety of factors that are likely to be involved in prioritizing street maintenance projects, it is unlikely that this data alone could be used to conclude that neighborhood income influences the DPW's response to pothole complaints. Nevertheless, some additional data on neighborhoods and on street characteristics can help describe the relationship between neighborhood income and test whether other factors can explain the disparity. Assuming that response time to an individual pothole i is a function of individual complaint characteristics (Xi), neighborhood characteristics (Xa), and characteristics of the street segment (Xs), one can define a model as:
| Model 1 | Model 2 | Model 3 | |
|---|---|---|---|
| ln(incomea) | -0.036 [-0.062, -0.011] |
0.156 [0.126, 0.186] |
-0.003 [-0.034, 0.028] |
| pctWhitea | -0.73 [-0.79, -0.67] |
-0.17 [-0.23, -0.10] |
|
| southOfWashSti | -0.58 [-0.62, -0.55] |
||
| requestOrigini: Phone | (reference) | ||
| requestOrigini: RequestIndy Mobile | -0.059 [-0.094, -0.025] |
||
| requestOrigini: RequestIndy Online | 0.001 [-0.029, 0.032] |
||
| streetClasss: State Highways | (reference) | ||
| streetClasss: Major Streets | -0.048 [-0.094, -0.002] |
||
| streetClasss: Local Streets | 0.066 [0.013, 0.119] |
||
| speedLimits (mph) | 0.0024 [-0.0014, 0.0062] |
||
| Intercept | 4.76 [4.48, 5.03] |
3.16 [2.86, 3.46] |
4.66 [4.25, 4.90] |
| N | 30,921 | 30,921 | 30,921 |
| Adjusted R-squared | 0.00022 | 0.02004 | 0.05587 |
Adding another neighborhood characteristic, the percent of residents who are white, reverses the sign of the estimated relationship between income and response time. This isn't too surprising, as race and income are known to be correlated, but it does change the story significantly, as it implies that the disparity may be more accurately described in terms of race than of income.
After including more complaint, neighborhood, and street characteristics (model 3) it still seems true that the racial disparity in response times is more significant than any income disparity. The estimated coefficient on income is focused closely around zero, whereas the relationship between the white population percentage and response time is decidedly negative. But still, the size of the effect does not seem large: a 10 point increase in the white percentage of the population is associated with just a 1.7% decrease in pothole response time.
Given the complexity of prioritizing street maintenance and the relationships between race, income, and geography, it is possible that these estimates are still biased due to factors not included in the model. But the results are suggestive and can at least serve as a reminder that that policies and procedures can have disparate impacts on different groups of people, even when it is not intended.